Network performance of Kubernetes CNI plugins
We built Ansible automation that installs a Kubernetes CNI plugin, tunes the hosts and measures bandwidth and latency against the same network without Kubernetes, then used it to compare Antrea, Calico, Cilium and Flannel. Two 2024 papers in MDPI journals report the method and the results on 10 Gbit/s links. A 2026 paper in Electronics takes the comparison to 100 Gbit/s Ethernet and InfiniBand, adds pod-level RoCE, and shows that on multi-homed nodes the interface carrying the node addresses decides which link CNI traffic uses.
This is joint work with Vedran Dakić, Jasmin Redžepagić and Luka Žgrablić at Algebra University, published in 2024 as two papers: one in Computers on the automation, one in Electronics on the measurements. The author-contribution statements of both list me for validation, formal analysis and investigation. The 2026 follow-up in Electronics, with Vedran Dakić, Mario Kovač and Josip Knezović, moves the work to 100 Gbit/s hardware, and I am its first author.
The question
Traffic between pods on different Kubernetes nodes goes through a CNI plugin. Flannel encapsulates it in VXLAN, Calico routes it with BGP, Cilium uses eBPF and Antrea uses Open vSwitch. We wanted to know what each costs in bandwidth and latency against the same hosts without Kubernetes, and how much Linux tuning changes that, for HPC workloads where either number can be the bottleneck.
The setup
Two HPE ProLiant DL380 Gen10 servers (two Xeon Silver 4108 CPUs, 128 GB each) ran Ubuntu 24.04, Kubernetes 1.30.2, Antrea 2.0.0, Calico 3.20.0, Cilium 1.15.6 and Flannel 0.25.4. The network setups were 1 Gbit/s on the built-in HP 331i ports, 10 Gbit/s copper on Intel X550-T2 cards, 10 Gbit/s fibre on Mellanox ConnectX cards, aggregated 10 Gbit/s links, and a local run on one machine. iperf measured bandwidth and netperf latency, over TCP and UDP, at MTU 1500 and 9000, with packets of 64, 512, 1472, 9000 and 15,000 bytes.
Every combination ran at eight tuning levels: the untuned default, five
built-in tuned profiles (accelerator-performance, hpc-compute,
latency-performance, network-latency, network-throughput) and two we wrote.
kernel_optimizations raises the socket buffer maximum to 16 MB and changes TCP
settings such as window scaling and the SYN backlog. nic_optimizations
enables generic receive offload and raises the ring buffers from 256 to 4096
packets.
The framework has since gained RDMA tests on two hosts with 100 GbE Mellanox ConnectX-5 EN cards, which are Ethernet-only, so RDMA runs as RoCEv2. The 2026 paper reports those results, together with CNI measurements over IPoIB on a second pair of hosts with ConnectX-5 cards in InfiniBand mode.
How the automation works
A shell script, run_all_tests.sh, drives Ansible playbooks through nested
loops. For each CNI they install the plugin from its Helm chart, step through
tuning levels, network setups, MTUs and packet sizes, run each TCP test five
times and each UDP test twice, then remove the CNI. Results are averaged and
loaded into MySQL for Grafana. The same playbooks measure the hosts without
Kubernetes, which gives the baseline for every result below.
A full run takes about 40 hours per CNI, unattended. Done by hand once for comparison, the same tests took one person 60 hours, plus 10 more to collect and analyse the data.
What we found
The results below come from the 2024 papers and cover the 10 Gbit/s setups.
Bandwidth held up for small packets and collapsed for large ones. For the
smaller sizes TCP was at worst 10% below the physical network. At 9000 bytes
and above, in the accelerator-performance profile, every CNI lost 4 to 5 Gbit/s.
Most large-packet runs could not reach half the link, while the physical
baseline came close to full saturation. UDP lost about 20% at 1472 bytes and
40 to 50% at 9000. Tuning changed the order: Calico was about 2 Gbit/s ahead
with large packets in the default profile and gained about 2.5 Gbit/s from
kernel_optimizations, at 5 to 6 ms more latency, while under
nic_optimizations Antrea led by about 2 Gbit/s.
TCP bandwidth below the physical network in the hpc-compute profile, in Gbit/s (Electronics, Table A1):
| Packet size (bytes) | Antrea | Cilium | Calico | Flannel |
|---|---|---|---|---|
| 64 | −0.03 | −0.01 | −0.08 | −0.09 |
| 512 | −0.12 | −0.09 | −0.14 | −0.14 |
| 1472 | −1.02 | −0.93 | −0.85 | −0.82 |
| 9000 | −4.33 | −4.32 | −4.23 | −4.10 |
| 15,000 | −5.21 | −5.11 | −4.93 | −4.88 |
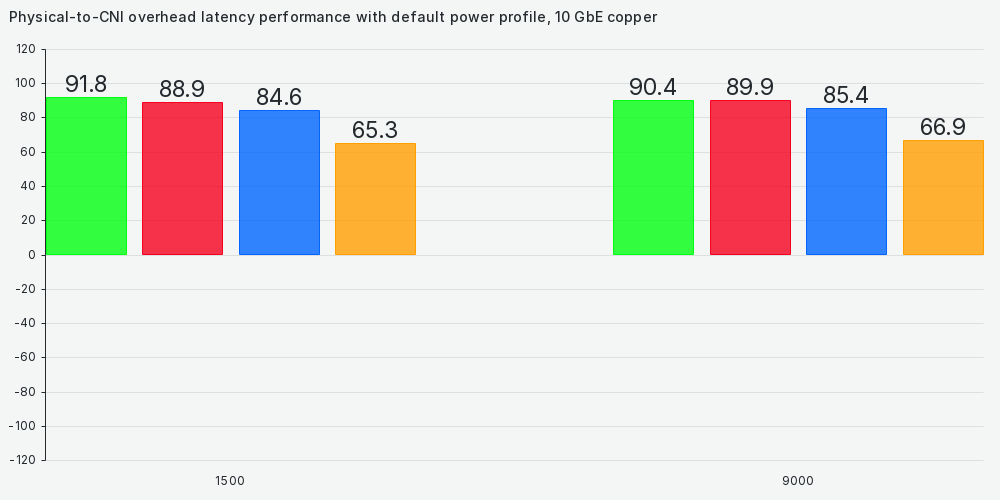
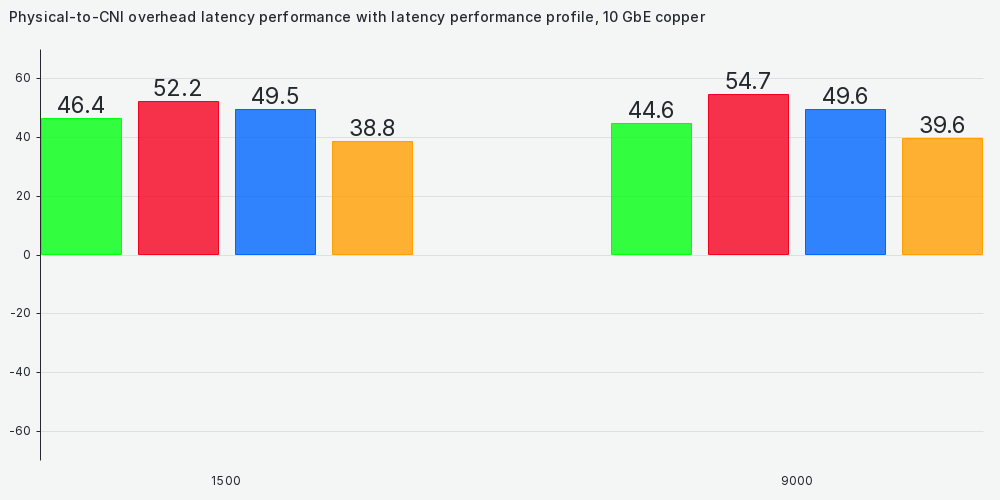
In the default profile the CNIs added 65 to 92 ms of TCP latency, the worst case in the study. The latency-performance profile cut that by 40 to 50%. Flannel had the lowest TCP latency in every profile, about 20% below the others, which surprised us, since encapsulation should cost latency. It also led on UDP latency. Per-node CPU overhead was under 3% for Calico and Flannel, about 5% for Antrea and up to 7% for Cilium.
Limits the 2024 papers state
- Two servers. Electronics puts a run across hundreds or thousands of nodes out of reach, at an investment measured in millions of euros or dollars, and it proposes scaling a setup like ours to ten or twenty nodes and modelling the rest from that data. Computers wants the code extended to evaluate hosts against each other in a mesh, up to an arbitrary number of hosts.
- No results above 10 Gbit/s, and no offload hardware such as DPDK adapters or FPGAs.
- UDP ran twice per combination against five times for TCP, because earlier testing showed extra runs made a negligible difference.
Electronics states one further thing as an expectation: Cilium’s layer 7 deep packet inspection would cost significantly if it were used. It was not used. Our automation installs Cilium from the stock Helm chart and defines no layer 7 policy, so none of the numbers above cover layer 7 filtering.
The 2026 paper
The 2026 paper runs the same automation on two pairs of servers with NVIDIA/Mellanox ConnectX-5 cards. In the first pair the cards run in Ethernet mode at 100 GbE, and that pair also carries the RoCE tests. In the second they run in InfiniBand mode and pod traffic goes over IPoIB. Antrea, Calico, Cilium and Flannel were installed from their default Helm charts and measured across nine tuning profiles. The data and analysis code are on Zenodo.
On the Ethernet pair every CNI stopped at 0.908 Gbit/s of TCP, whatever the profile, MTU or packet size. That is the payload rate of the 1 GbE management link, which carried the Kubernetes node addresses. A default install sends pod traffic over the interface that holds the node address, and on a multi-homed server that is often the slowest link in the machine. Nothing in Kubernetes warns about it. The InfiniBand pair showed the same effect at 9.1 Gbit/s over its 10 GbE management link. Moving the node addresses to IPoIB raised the best CNI result to 44.4 Gbit/s, against 46 Gbit/s for the hosts themselves.
With the traffic on IPoIB, median TCP throughput was 42.4 Gbit/s for Flannel, 32.9 for Cilium, 32.2 for Antrea and 7.0 for Calico. Calico stayed near 7 Gbit/s on both links because its default datapath is IP-in-IP. Flannel again had the lowest latency at every tuning level, but the tuning profile moved every CNI’s latency by a factor of about 2.7, more than the 4 to 14 µs that separated the CNIs at any one level.
RoCE bypasses the CNI. A pod attached through the RDMA shared-device plugin reached 96.9 to 97.8 Gbit/s at MTU 9000, the same as the host, with latency of 0.835 to 2.035 µs depending on message size.
For a cluster on a fast fabric this means setting the node address explicitly
(kubelet --node-ip), binding the CNI to the fast interface and checking the
interface byte counters to confirm pod traffic really uses it. Workloads that
need the full link should get an RDMA-capable interface next to the CNI one.
The paper lists its limits:
- The two pairs differ in servers, software, NIC mode and link type, so differences between them cannot be put down to link speed alone.
- The InfiniBand cards sit in PCIe x8 slots, which held the hosts to about 46 Gbit/s over IPoIB, and IPoIB datagram mode caps the MTU at 2044 bytes. CNI traffic on a 100 GbE Ethernet link was not measured.
- Each CNI ran as a default chart install with only the data-path interface pinned. Tuned setups, such as Calico with VXLAN or Cilium with eBPF host routing, may rank differently.
- Each CNI was installed once per environment, with two samples per condition.
- The study measures network transport only, not GPU, NCCL, MPI or training performance.
Publications
- Methodology for Automating and Orchestrating Performance Evaluation of Kubernetes Container Network Interfaces 2024
- Performance and Latency Efficiency Evaluation of Kubernetes Container Network Interfaces for Built-In and Custom Tuned Profiles 2024
- Kubernetes Networking on Multi-Homed ConnectX-5 Nodes: Node Address Path Selection, CNI Performance Over IPoIB, and Pod-Level RoCE 2026